Midterm Report
Page URL
https://weiyuzh.github.io/CS766-Project/midterm.html
CS 766 Project: Cluster Analysis on Neural Cell Imaging
Group Members:
- Nomin Khishigsuren
- Roy Sun
- Trevor Zachman-Brockmeyer
- Weiyu Zhang
Prologue
As described in our original proposal, our overall goal for this project is to explore automated cell detection via image analysis. In addition to reviewing existing algorithms for image-based cell recognition, we planned to investigate two specific areas: - Clustering of multiple cells into a single object - due to the nature of the cells that we are processing, multiple cells may appear as a single cluster without clear delineations between neighboring cells. We plan on developing specific workflows for detecting and separating these clusters of multiple cells. - Alignment of the same cells across multiple images - due to the imaging acquisition process, images in our dataset are linked vertically as shown in Figure 1. That is, each image is a horizontal slice of a 3D object. We hope to use this relationship to assist in detecting and counting cells.
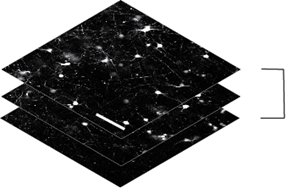
Fig 1. Sample image data for analysis that showcases the vertical alignments of cells.
Current Progress
Our plan was to find an existing solution that could be adapted and re-implemented for our analysis. After exploring many different softwares and libraries that are open-source and available to the public, we have decided to use CellProfiler, Python-based cell image analysis software. For our pre-processing of the images in our dataset, we used the following modules and pipeline:
1. Erosion: The original sliced images have a large amount of background noise in the form of neural connections between individual clusters as well as tips of cells present in distant neighboring slices. In order to better analyze the clusters, this noise was removed using erosion.
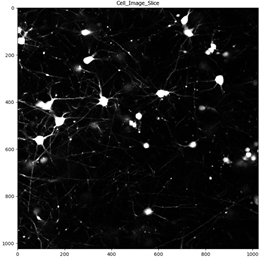
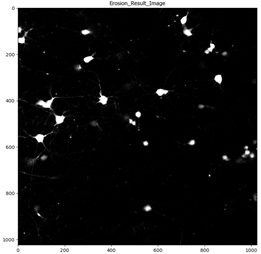
Fig 2. Left image: original image slice in our dataset. Right image: better visualized clusters after erosion.
2. Identify Primary Objects: Using CellProfiler’s IdentifyPrimaryObjects module, we were able to obtain cell structures within the neuronal clusters.
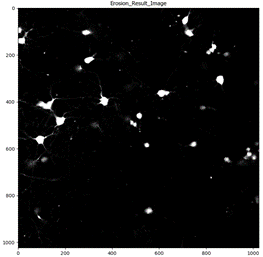
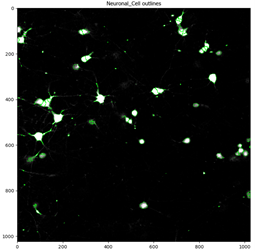
Fig 3. Images showing left: after erosion and right: showing boundaries of the objects found by the software.
3. Filtering for Size: The object detection process, while finding the correct cells within clusters, also detected small pixel noise that were remnants of the erosion modifications. In order to detect only the cells we are interested in, we ran our objects through a size filter, discarding any detected objects that were smaller than a specified threshold.
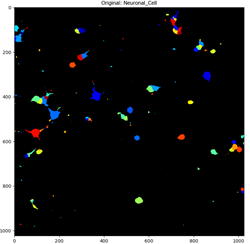
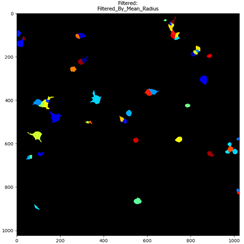
Fig 4. Identified neuronal cells before and after being filtered.
4. Exporting relevant data for post-processing stitching process: Each object that was not filtered out then had its center pixel location logged to a csv. The post-processing stitching process may also require other data on the objects such as size, orientation, or brightness, all of which we will be able to calculate if needed.
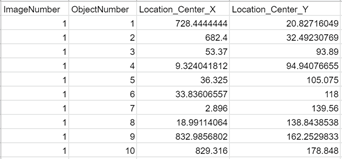
Fig 5. Example data that is exported for detected objects after the pipeline.
Implementation Difficulties
The fine tuning process could be particularly tricky due to the myriad of different neuron cells. There could be many different outlier shapes that our algorithm fails to detect, and adjusting the algorithm to account for all of them could be extremely time-consuming.
Another potential problem that could arise is transferring the exported data from the CellProfiler and running weighted cross-correlation depending on the height or slice difference. For example, as shown in Figure 6, the nearest two slices would contribute the most to the cross-correlation and cell count for the image slice in the middle. Another problem that could potentially arise is comparing the counted cells to the ground truth. We’re planning the ground truth of the cell count to be the counted-by-hand images with marks on the cells for all slices.
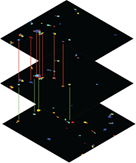
Fig 6. A schematic showing the proposed post-processing image analysis using the data for the detected objects from CellProfiler and the cross-correlation.
We have also investigated reconstructing 3D structures using the series of image slices. We hope to repurpose the reconstruction process for linking cells across multiple images. Similar processes are used for CT scans, for both medical and non-medical (e.g. TSA baggage screening) applications. We are still investigating current algorithms, many of which are based on convolutional neural networks [1]. However, we have not made as much progress on this front.
How the proposal has changed in light of progress
In our original proposal, we stated that “our plan is to find an existing solution that could be adapted and re-implemented for our analysis.” The proposal has remained largely the same in light of current progress. We were able to identify a promising solution through the help of CellProfiler, and now we aim to explore that solution in greater detail over the upcoming weeks.
Because we will be mainly focusing on CellProfiler, we will pause pursuing some of the other technologies mentioned in our initial proposal such as Qupath and Neuron Studio. If the CellProfiler algorithm does not produce satisfactory results, we will at that time continue to pursue these other technologies.
References
[1] Qian Wang, Neelanjan Bhowmik, and Toby P. Breckon. 2020. Multi-Class 3D Object Detection Within Volumetric 3D Computed Tomography BaggageQian Wang, Neelanjan Bhowmik, and Toby P. Breckon. 2020. Multi-Class 3D Object Detection Within Volumetric 3D Computed Tomography Baggage Security Screening Imagery. 2020 19th IEEE International Conference on Machine Learning and Applications (ICMLA) (2020). DOI:http://dx.doi.org/10.1109/icmla51294.2020.00012 Security Screening Imagery. 2020 19th IEEE International Conference on Machine Learning and Applications (ICMLA) (2020). DOI:http://dx.doi.org/10.1109/icmla51294.2020.00012